[1] 2.4A Tour of R
(Sections 1.2-1.6)
Arithmetic
Some Arithmetic
R can be used like a calculator:
To get \(3^2 + 4^2\) try:
More Arithmetic
Cube-root of 64:
R has a special square-root function:
Practice
Write one line of R-code to find:
\[\sqrt{3^2 + 4^2}\]
Variables
“Storing” a Value
<-is the assignment operator- it binds the name
ato the value 10
Stored Value
Now you have the 10 whenever you want:
Descriptive Variable-Names
Information about a creature in the Land of Oz:
Reusing our Variables
About paste()
paste()is also a function- it “pastes” its arguments together …
- … with
sepstuck in between - so when
sep="", nothing is in between
Observe …
- Arguments for a function are separated by commas.
- R basically ignores “whitespace”
- including newlines
- so you can spread a single command across many lines!
Whitespace Still Matters …
… inside values:
## Error: unexpected numeric constant in "100 3"Special Newline Character!
\n will make a new line:
paste("Hello, I am a ",
      creatureType,
      ".\nMy name is ",
      creatureName,
      ".\nI like to eat ",
      creatureFood,
      ".",
      sep = "")
[1] "Hello, I am a Munchkin.\nMy name is Boq.\nI like to eat corn."Well, not when just printed!
Let’s cat() it, Instead
Variables Upon Variables!
Functions
Reusing Your Code
In order to re-use a useful bit of code, make a function out of it:
This defines a function called intro().
Using our Function
To use a function, call it:
Parameters and Arguments
- Parameters are names that you use inside the body of the function
- Arguments are the values you assign to the parameters when you call the function
| Parameter | Argument |
|---|---|
name |
“Frederick” |
type |
“Winkie” |
food |
“macaroni” |
You Can Be Lazy
You can skip the names of the parameters:
Hello, I am a Winkie.
My name is Frederick.
I like to eat macaroni.But you must keep the arguments in the order of the parameters you want to assign them to.
Data and Graphics
A Contributed Package
- mosaicData is a contributed R-package
- It contains some datasets that are interesting and useful
Let’s attach this package:
Births78
Births78is a data frame.- data frames are an important kind of data structure in R
Data Structure
A particular way of organizing information in a computer program so that it can be used efficiently.
Take a Peek
         date births wday year month day_of_year day_of_month day_of_week
1  1978-01-01   7701  Sun 1978     1           1            1           1
2  1978-01-02   7527  Mon 1978     1           2            2           2
3  1978-01-03   8825  Tue 1978     1           3            3           3
4  1978-01-04   8859  Wed 1978     1           4            4           4
5  1978-01-05   9043  Thu 1978     1           5            5           5
6  1978-01-06   9208  Fri 1978     1           6            6           6
7  1978-01-07   8084  Sat 1978     1           7            7           7
8  1978-01-08   7611  Sun 1978     1           8            8           1
9  1978-01-09   9172  Mon 1978     1           9            9           2
10 1978-01-10   9089  Tue 1978     1          10           10           3
More of a Peek
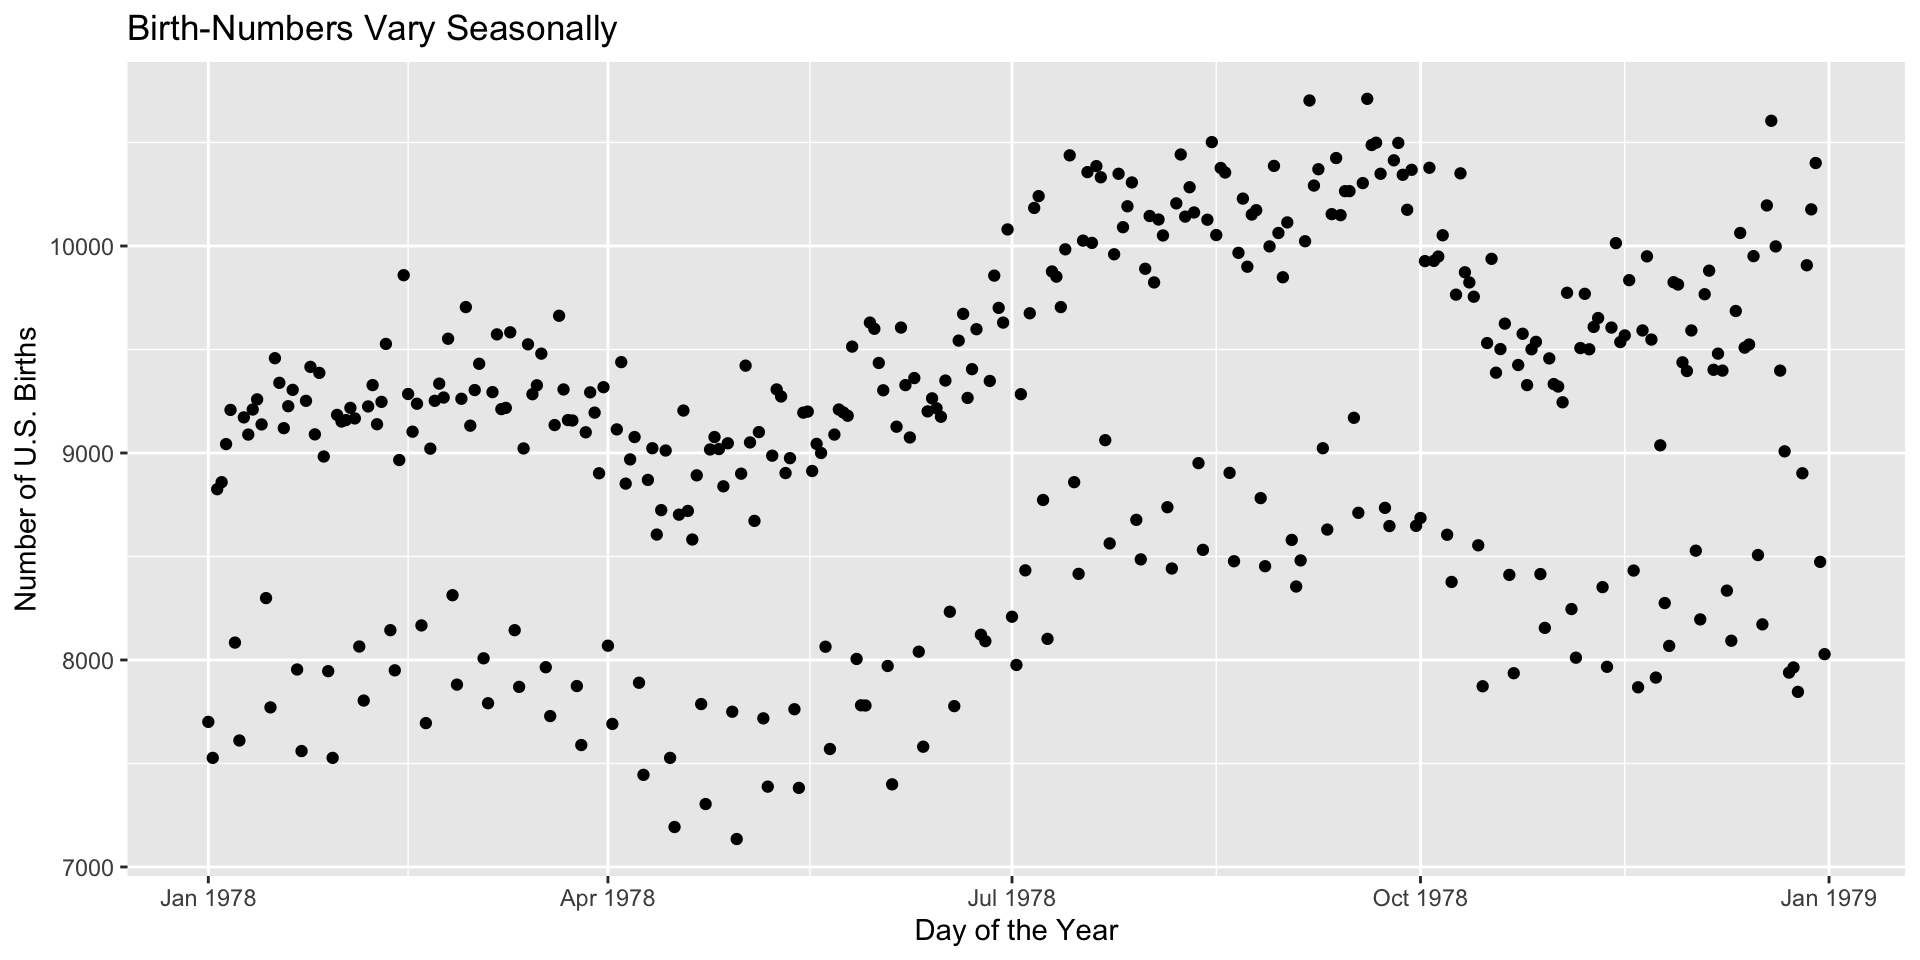
Research Question
Does the daily number of births vary with time of year?
Making a Graph
Interactive Graphs
A Network Graph
Code
## source:  https://r-graph-gallery.com/network-interactive.html
# Libraries
library(igraph)
library(networkD3)

# create a dataset:
data <- data.frame(
  from=c("A", "A", "B", "D", "C", "D", "E", "B", "C", "D", "K", "A", "M"),
  to=c("B", "E", "F", "A", "C", "A", "B", "Z", "A", "C", "A", "B", "K")
)

# Plot
p <- simpleNetwork(data, height="400px", width="400px")

p
Playing Games!
“All work and no play makes Jack a dull boy.”