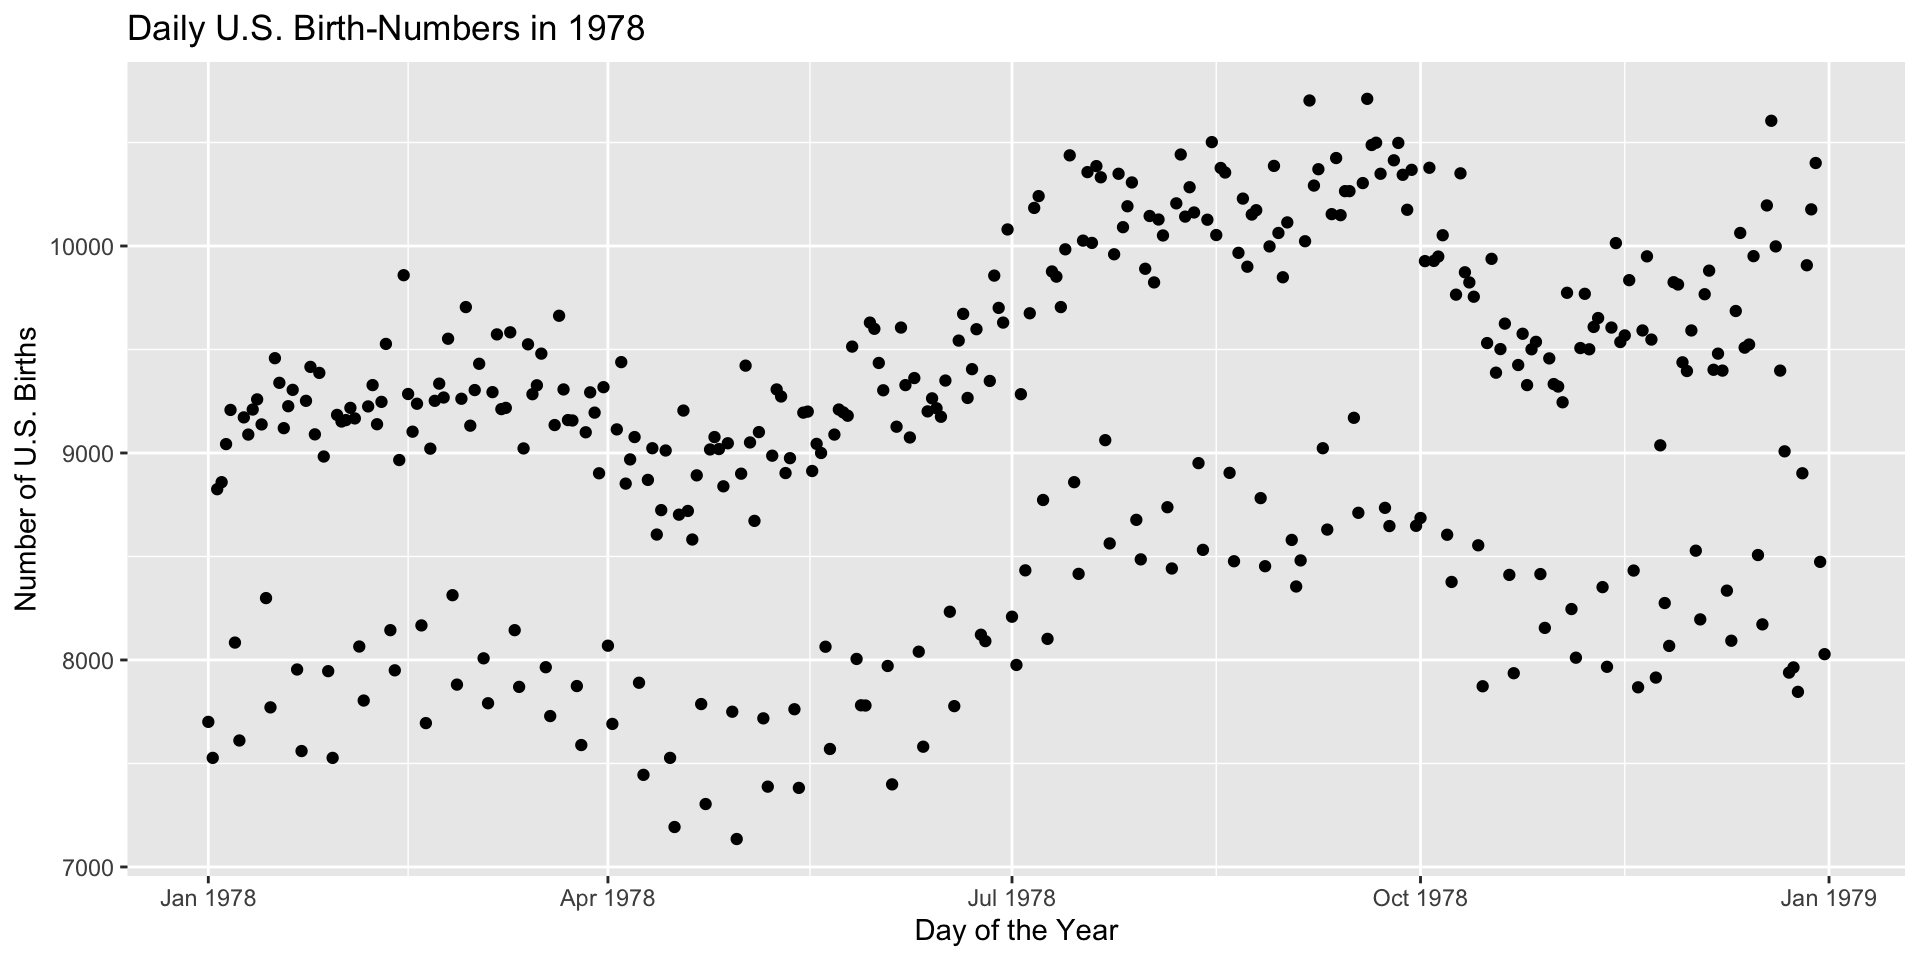
ggplot(Births78, aes(x = date, y = births)) +geom_point() +labs(x ="Day of the Year", y ="Number of U.S. Births",title ="Daily U.S. Birth-Numbers in 1978")
Some of the days have significantly fewer births. What’s going on?
A Hunch About What’s Going On
Are there fewer births on weekends? Try this:
New Variable
This new variable says whether or not a day is at the end of the week: